PatsFans.com Menu
PatsFans.com - The Hub For New England Patriots Fans

Content Post All-Time QB Rankings / QB Hall of Fame Monitor


This has an opening post with good commentary and information, which we definitely recommend reading.
I love watching the old videos of Baugh and Luckman. Two very different styles. Baugh is tall and skinny, holds the ball above his head; Luckman is shorter and a much lower center of gravity.

Baugh is often credited with establishing "the forward pass" but that's a historical inaccuracy. The passing game was much more mature in 1937 than football pundits give it credit for. This is where I think these descriptions become somewhat backhanded compliments, like he entered a league of cavemen who only knew how to smash into a wall of people. What I think he's responsible for is:

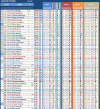
-Just being flat out better than the rest of them. His records are pretty similar to Steve Young; highest rated passer, lowest INT %, most points scored, etc., and often by a pretty big margin, besides Luckman.

-Creating a strategy based around the passing game, and in particular, using the short and intermediate passes to drive down the field. The idea that putting together these drives started with Unitas is another off-base, oft-repeated pop culture myth. Baugh had a fantastic arm but he is the first quarterback to "pick apart" defenses.

-The 1937 NFL Championship game is, I think, a big turning point for quarterbacks. 18/33, 335 yards, 3 TDs, 1 INT.
 
I didn't wade through all the responses so don't know if this was brought up. The main issue I have with this list is that it only adds, it never subtracts. So if you have 4 great years and 10 terrible years, you're a HOF QB? As opposed to the QB that was very good for 10 years with 2 great years? No, you need to subtact for bad performance, as least during a player's prime, not just give credit for good performance. I understand there's a good case for ignore the tail end years, but not bad QB play during your prime. Just a thought.

Another issue is the double and triple counting of playoff success. So if you win a Super Bowl, you get credit in multiple playoff categories instead of just one. I'd change that to only giving credit to the highest level achieved in any given year.

I don't know a good way to adjust for how important the QB was to the team's success. Some teams are defensively driven and others are offensively driven. Obviously, the QB has much less impact on defensively driven teams than offensively driven teams. But the rankings rank them all the same.

Pro bowl stats should likewise be compared over the length of a career (or subtract out when a QB doesn't make a pro bowl) if you really think pro bowl is meaningful. Having 4 pro bowls over 8 years is a very different story than 4 pro bowls over 16 years.
 
With DVOA going back to 1983 at the moment, all the seasons are there for quite a few quarterbacks. I used estimated numbers for Montana in 1981, 1982. And I'm counting a qualified season where the quarterback started at least 50% of his teams games.


Average Offensive Ranking
1. Joe Montana: 3.7
2. Tom Brady: 4.8
3. Steve Young: 5.5
4. Aaron Rodgers: 5.8
5. Dan Marino: 6.1
6. Peyton Manning: 6.2
7. Drew Brees: 6.8
8. Russell Wilson: 7.2
9. Ben Roethlisberger: 9.5
10. John Elway: 9.9
11. Brett Favre: 10.9
12. Jim Kelly: 11.3
13. Troy Aikman: 11.5
14. Kurt Warner: 12.8

Average Defensive Ranking
1. Joe Montana: 7.9
2. Russell Wilson: 9.3
3. Ben Roethlisberger: 9.6
4. Steve Young: 11.2
5. Brett Favre: 12.4
6. Jim Kelly: 13.7
7. John Elway: 14.1
8. Kurt Warner: 14.6
9. Tom Brady: 14.7
10. Troy Aikman: 15.7
11. Peyton Manning: 15.7
12. Aaron Rodgers: 15.8
13. Drew Brees: 17.5
14. Dan Marino: 19.6

EDIT: Added Favre
 
Last edited:
I didn't wade through all the responses so don't know if this was brought up. The main issue I have with this list is that it only adds, it never subtracts. So if you have 4 great years and 10 terrible years, you're a HOF QB? As opposed to the QB that was very good for 10 years with 2 great years? No, you need to subtact for bad performance, as least during a player's prime, not just give credit for good performance. I understand there's a good case for ignore the tail end years, but not bad QB play during your prime. Just a thought.

Another issue is the double and triple counting of playoff success. So if you win a Super Bowl, you get credit in multiple playoff categories instead of just one. I'd change that to only giving credit to the highest level achieved in any given year.

I don't know a good way to adjust for how important the QB was to the team's success. Some teams are defensively driven and others are offensively driven. Obviously, the QB has much less impact on defensively driven teams than offensively driven teams. But the rankings rank them all the same.

Pro bowl stats should likewise be compared over the length of a career (or subtract out when a QB doesn't make a pro bowl) if you really think pro bowl is meaningful. Having 4 pro bowls over 8 years is a very different story than 4 pro bowls over 16 years.

These are all great points, and I've tried to account for all of them. In fact, you've kind of hit on exactly what I'm trying to do differently and where I think a lot of QB ranking systems have run into some problems. The first post in this thread is a Hall of Fame tracker, so while there is some degree of efficiency, more of it is cumulative accomplishments...but that's why I've been playing around with the formulas to set a better system. If you've had a chance to look at some of the other charts, you'll see they've gone away from that. To address your points, though:

Much of the score is indeed based on a points-per-season basis. Win %, passer rating, etc. are the biggest factors...and those are based on career averages but then adjusted for era (imagine that each season is the same amount of games.)

Postseason success is not counted much...it helps or hurts slightly by weighting one's overall winning percentage. I agree that championships already cover this and the postseason is double dipping...but...it isn't irrelevant either. When it comes to winning percentage, the playoff win/loss record is very important to the team's overall success, moreso in those games than in regular season games. I have the default that a playoff game counts as 5X wins/5X losses. That doesn't make a big dent for for most players, but it may decide a tiebreaker now and then.

Accolades like pro bowl, MVP, etc. are also based on a percentage; I converted the awards amount over a career, so a guy who gets 4 pro bowls in 15 seasons is going to fall down the rankings, whereas a guy who has 12 in 12 is going to shoot up.

In terms of defensive support...the idea is that, over a long period of time, that should become less important. If a guy plays for 4 seasons and has a great defense, his win % will be watered down anyway due to small sample size. But overall, a great defense will help win % but not the other performance stats, and even the championship shares are weighted by perfromance and accolades to try to avoid a team carrying a player. If you look at Terry Bradshaw, for example, you'll note that despite having 4 Super Bowls, he's still not close to other guys with that level of championship success. He has 9.6 points for his championship share while Montana gets 13.3. Big difference...he also has a C+ in the accolades index, wheras Montana has an A. This is how I try to check/balance the winning percentage. Bradshaw doesn't have a ton of individual awards but has a very high win %...that's where the great defense carrying the player will show up in the points.

Maybe the new style of rankings will shed some light on these...let me know what you think and if this makes sense. Note that the Playoffs and Awards scores are both combined with actual winning percentage.

1617212944504.png
 
Last edited:
With DVOA going back to 1983 at the moment, all the seasons are there for quite a few quarterbacks. I used estimated numbers for Montana in 1981, 1982. And I'm counting a qualified season where the quarterback started at least 50% of his teams games.


Average Offensive Ranking
1. Joe Montana: 3.7
2. Tom Brady: 4.8
3. Steve Young: 5.5
4. Aaron Rodgers: 5.8
5. Dan Marino: 6.1
6. Peyton Manning: 6.2
7. Drew Brees: 6.8
8. Russell Wilson: 7.2
9. Ben Roethlisberger: 9.5
10. John Elway: 9.9
11. Jim Kelly: 11.3
12. Troy Aikman: 11.5
13. Kurt Warner: 12.8

Average Defensive Ranking
1. Joe Montana: 7.9
2. Russell Wilson: 9.3
3. Ben Roethlisberger: 9.6
4. Steve Young: 11.2
5. Jim Kelly: 13.7
6. John Elway: 14.1
7. Kurt Warner: 14.6
8. Tom Brady: 14.7
9. Troy Aikman: 15.7
10. Peyton Manning: 15.7
11. Aaron Rodgers: 15.8
12. Drew Brees: 17.5
13. Dan Marino: 19.6

Great stuff!

I've always wondered about where the Patriots defense actually ranks, as we typically have those enormous splits with ppg and ypg. It's interesting to see where the DVOA rates them. Clearly Brady doesn't have the incredible defensive support that's expected...and frankly, the overall numbers here kind of lead me to the same conclusion I've suspected for awhile...the longer one's career, the more likely their defensive average will float towards the middle of the pack. Clearly there are some exceptions though.

By the way, on the recent chart, you'll see that Brady is now at 54.99. I had to up the maximum because he keeps breaking the system. On the Peak Score, he's 10th overall now due to the criteria change, so he's no longer losing ground there :rofl: :rofl: :rofl: :rofl: :rofl: . Maybe I should just clip his championship points...lmao.
I just added Favre, for some reason I didn't include him on the original list.

Yep, whenever you see someone trying to discredit Brady or say Montana, Manning, etc are better they'll always spout off about top 10 scoring defense. But when you look a little deeper you'll see there are multiple reasons for those highly ranked scoring defenses. Brady controlling the ball, avoiding getting into shootouts, weak opposing quarterbacks, etc. A lot of his defenses were good, but PPG overrates them IMO.

That's hilarious :rofl:. He's out here breaking the system. The gap between him and #2 is absolutely crazy!
 
Also to follow up on that last point, I want to clarify that this is not a cumulative system. There are only two things that can be added without regard to a ticking clock.

Championships, including conference titles, have only positive values and can't be negative. I could potentially change that and create a championship points/seasons played ratio. That's when you may even see Manning get surpassed by Young, Staubach, etc. But honestly, I don't like it. It's not in the spirit of what fans value.

The number of accrued seasons is a small add-on in the awards index...so a guy with 16 seasons like Eli Manning will get a very slight advantage over a guy with 5 seasons. The idea is that being awarded the starting job that many years is a small accomplishment in itself and leads to franchise stablitity.

With every other category, 0 is the baseline average. While the intent here is rankings based on accomplishements and performance, you should see borderline starters show up around the 0 mark and then backups below the 0 mark. If I removed championships altogether, it would probably be a more accurate picture...below is what it looks like without championship points, but it does still account for career that haven't fully developed yet (hence Eli over Watson.) This chart isn't perfect, but I'm trying to give a general idea of how it applies the same system for all-time rankings to a smaller timeframe to paint some broad stroke tiers.

1617214125564.png
 

Attachments

  • 1617213684612.png
    1617213684612.png
    248.5 KB · Views: 1
Here's where we stand on the Super Bowl era rankings (I personally think Dawson, Starr, Unitas are from a different era despite some overlap.) I had to make anonymous one player who seems to get us sidetracked.

Personally, I think the list is good overall...but I think some of the issues I'm seeing on the all-time rankings (1920-2020) are also showing up intra-tier. Despite trying to adjust for era...

Rodgers at 6 - in a deadlock with Staubach and Young - seems very high. Are there some cases where the new peak score is double dipping too much? I've tried to tone down the impact while still making a difference, but it seems like Rodgers already has a very high era rating and this is just padding that difference. I think Rodgers should probably be closer to Brees than Young. Brees is only a slot down, but it's the score I'm looking at.

Or it may be that I need to scale down the era rating to account for the peak score...I'm looking at Wilson/Roethlisberger, who are really frustrating me as I've been trying to find the right adjustment. I personally don't see these two as the 12th and 13th best. Am I just biased about this? It's no like these guys are't really good. I just see Roethlisberger closer to 17-20 and Wilson closer to 15.

It makes me wonder a few things...does the salary cap era also need to be treated differently and have its own small changes? Or perhaps the 1980s? So far, I've made some changes to the earlier eras to give the quarterbacks a share of credit proportionate to their snaps; I'm wondering if there's something I'm missing here - tangible - that shows winning a lot of games and putting up a high passer rating/peak score today is a lot easier today, even after adjusting the baseline stats. Because when we look at the previous 50 years of Super Bowl era football, I'm skeptical that 6 of the top 13 are active players or recently retired. And the trend continues when we get to #25 and see Romo, McNabb, and Ryan up there leading the non-HoF tier.

1617215121026.png
 

Attachments

  • 1617215045739.png
    1617215045739.png
    295.4 KB · Views: 3
Last edited:
I just added Favre, for some reason I didn't include him on the original list.

Yep, whenever you see someone trying to discredit Brady or say Montana, Manning, etc are better they'll always spout off about top 10 scoring defense. But when you look a little deeper you'll see there are multiple reasons for those highly ranked scoring defenses. Brady controlling the ball, avoiding getting into shootouts, weak opposing quarterbacks, etc. A lot of his defenses were good, but PPG overrates them IMO.

That's hilarious :rofl:. He's out here breaking the system. The gap between him and #2 is absolutely crazy!

For the sake of this project, I might need to start rooting for Brady to start playing like crap...no more championship, lower performance scores. He really does break the freaking system with his scores. Lol.
 
Here's where we stand on the Super Bowl era rankings (I personally think Dawson, Starr, Unitas are from a different era despite some overlap.) I had to make anonymous one player who seems to get us sidetracked.

Personally, I think the list is good overall...but I think some of the issues I'm seeing on the all-time rankings (1920-2020) are also showing up intra-tier. Despite trying to adjust for era...

Rodgers at 6 - in a deadlock with Staubach and Young - seems very high. Are there some cases where the new peak score is double dipping too much? I've tried to tone down the impact while still making a difference, but it seems like Rodgers already has a very high era rating and this is just padding that difference. I think Rodgers should probably be closer to Brees than Young. Brees is only a slot down, but it's the score I'm looking at.

Or it may be that I need to scale down the era rating to account for the peak score...I'm looking at Wilson/Roethlisberger, who are really frustrating me as I've been trying to find the right adjustment. I personally don't see these two as the 12th and 13th best. Am I just biased about this? It's no like these guys are't really good. I just see Roethlisberger closer to 17-20 and Wilson closer to 15.

It makes me wonder a few things...does the salary cap era also need to be treated differently and have its own small changes? Or perhaps the 1980s? So far, I've made some changes to the earlier eras to give the quarterbacks a share of credit proportionate to their snaps; I'm wondering if there's something I'm missing here - tangible - that shows winning a lot of games and putting up a high passer rating/peak score today is a lot easier today, even after adjusting the baseline stats. Because when we look at the previous 50 years of Super Bowl era football, I'm skeptical that 6 of the top 13 are active players or recently retired. And the trend continues when we get to #25 and see Romo, McNabb, and Ryan up there leading the non-HoF tier.

View attachment 31812
Player X :rofl:

Staubach, Young, and Rodgers all being that close makes me wonder if it’s the era-adjusted passer rating doing that. All three of them are extremely efficient.

I agree with Wilson and Roethlisberger. I see them closer to the 15-20 range than 12 and 13 when excluding the older quarterbacks. Then again when you’re doing Super Bowl era you open up a lot of slots for players to move up so it’s tough to tell.

I'm going to do some quick checks on different QB measures.

I thought that PFR had some stat that accounts for running plays by QBs, too. I see they have NY/A and ANY/A. What I'd like to know is what a quarterback averages per snap...so if it he scrambles, then whatever yardage counts as yards per play. I think that would be suitable for the Super Bowl era because there aren't many designed running plays, wheras you go further back in time and NY/A would be better (accounts for sacks but not rushing plays, which are often by design.)

But it looks like I'd have to combine two stats NY/A and rushing attempts/yards to get that figure. Not all that hard to do with an Excel copy-paste macro but kind of a pain nonetheless. I'm wondering if these stats will be roughly the same as what passer rating already gives me, though.
 
Look how crazy this is...Dan Marino's sack % (bold means league leader)

1617220032243.png


Aaron Rodgers sack %

1617220079592.png

There's just no freakin way that this shouldn't be a factor somewhere in the equation....this is a big deal. I do appreciate that Rodgers throws such few interceptions, but there's also no question he tries to manipulate his efficiency stats by taking sacks over throwing incompletions or interceptions. I might be able to just use this stat - sack % - in combination with passer rating, if I can find the right balance.

Also, even despite Rodgers playing in an era where NY/A is significantly higher, Marino's raw score is higher. Wow.

Time to back back under the hood...I suspect there's a reason a few guys are popping higher than they should. And yes, sacks is a quarterback stat, not a team stat.
 
Last edited:
Not too scientific in this approach, but here's what using a basic era-adjusted ANY/A did for the rankings. IMO, this is a lot more accurate because it's accounting for sacks and also takes away points for not being aggressive enough.

The passer rating-based scores were over-rewarding guys, which I've complained about for weeks....these seems to be more synced up with the overall offense's production.

First chart is what it looks like with only Era Rating and Peak Score, both of which have been adjusted from passer rating.

ANY/A can be used beginning in 1969 when sacks are recorded, so it helps to refine within the era. Fixed a bunch of problems with passer rating not aligning with scoring (Wilson, Roethlisberger way too high; Marino, Fouts, Tarkenton way too low; Rodgers waaaayyyy too high as an outlier.) The scores are more important than the rankings; Elway, for example, may only be 24th, but he goes from C grade to A grade, and he isn't losing a ton of points anymore; Eli is a similar situation.

1617228202709.png

Second chart is how it effects the overall rankings. Marino and Elway move up. Rodgers stays the same, but on the all-time chart he no longer passes Starr or Young. Wilson moves down. Eli moves up into borderline Hall of Fame range.

I'll be able to also use this for players who played part of their career pre-1969, but for now, I'm not able to because PFR's sack % isn't accurate for those guys; it counts the attempts from seaosns where sacks were't recorded, so it makes the numbers skewed. I can get it to work but not as instantly as players fully post-1969.

1617228121341.png
 

Attachments

  • 1617228163591.png
    1617228163591.png
    185.8 KB · Views: 0
Roger Staubach could have played and won in today's NFL. Stabler, Marino etc...these QB's read defenses quickly and released the ball as fast or faster than 90% of the QB's today. You have to remember, it was a different, much more violent league for QB's until Crapdell/Polian ruined the rules.

I agree with this conception, but it’s from the context that they would have grown up in this era. Their abilities and football/sports IQ would have developed in the era and they would have been just as good in this context. I don’t think that correlates to the game overall as today’s teams would have destroyed those teams if everything was equal. Jack Lambert was 220, and John Hannah was 265, they would probably be 260 and 310 today, but today’s game is much bigger and much faster, and in most sports that’s a big difference.
 
Use whatever formula you want, but growing up in the ‘90s, I always thought John Elway and Troy Aikman were football gods. I will always be hard pressed to think anybody was or is better than them.
 
Use whatever formula you want, but growing up in the ‘90s, I always thought John Elway and Troy Aikman were football gods. I will always be hard pressed to think anybody was or is better than them.

Steve Young?
 
Look how crazy this is...Dan Marino's sack % (bold means league leader)

View attachment 31816


Aaron Rodgers sack %

View attachment 31817

There's just no freakin way that this shouldn't be a factor somewhere in the equation....this is a big deal. I do appreciate that Rodgers throws such few interceptions, but there's also no question he tries to manipulate his efficiency stats by taking sacks over throwing incompletions or interceptions. I might be able to just use this stat - sack % - in combination with passer rating, if I can find the right balance.

Also, even despite Rodgers playing in an era where NY/A is significantly higher, Marino's raw score is higher. Wow.

Time to back back under the hood...I suspect there's a reason a few guys are popping higher than they should. And yes, sacks is a quarterback stat, not a team stat.

Geez I don't know. Horrible line play can affect a QBs sack percentage. Receivers not getting open etc.. can affect a QBs sack percentage. Playcalling can affect a QBs sack percentage. It's not all on the QB imo.
 
Use whatever formula you want, but growing up in the ‘90s, I always thought John Elway and Troy Aikman were football gods. I will always be hard pressed to think anybody was or is better than them.

That's a challenging argument.
 
Steve Young?
Never saw many Niners games living on the east coast, unfortunately. The Cowboys were on every week and the Broncos had a 3-4 year stretch of being the best team in the league and always had primetime games. That really strengthened my perspective. I appreciated QBs like Young, Warren Moon, and Jim Kelly as I got older.
 
Look how crazy this is...Dan Marino's sack % (bold means league leader)

View attachment 31816


Aaron Rodgers sack %

View attachment 31817

There's just no freakin way that this shouldn't be a factor somewhere in the equation....this is a big deal. I do appreciate that Rodgers throws such few interceptions, but there's also no question he tries to manipulate his efficiency stats by taking sacks over throwing incompletions or interceptions. I might be able to just use this stat - sack % - in combination with passer rating, if I can find the right balance.

Also, even despite Rodgers playing in an era where NY/A is significantly higher, Marino's raw score is higher. Wow.

Time to back back under the hood...I suspect there's a reason a few guys are popping higher than they should. And yes, sacks is a quarterback stat, not a team stat.
This is very true. Rodgers would rather take a sack than try and make a play. I have seen years where he has thrown his line under the bus while the line graded out well. I have always said that a QB can make a line better than they are, but also make them worse than they are.


Tuesday Patriots Notebook 4/16: News and Notes
Monday Patriots Notebook 4/15: News and Notes
Patriots News 4-14, Mock Draft 3.0, Gilmore, Law Rally For Bill 
Potential Patriot: Boston Globe’s Price Talks to Georgia WR McConkey
Friday Patriots Notebook 4/12: News and Notes
Not a First Round Pick? Hoge Doubles Down on Maye
Thursday Patriots Notebook 4/11: News and Notes
MORSE: Patriots Mock Draft #5 and Thoughts About Dugger Signing
Matthew Slater Set For New Role With Patriots
Wednesday Patriots Notebook 4/10: News and Notes
Back
Top