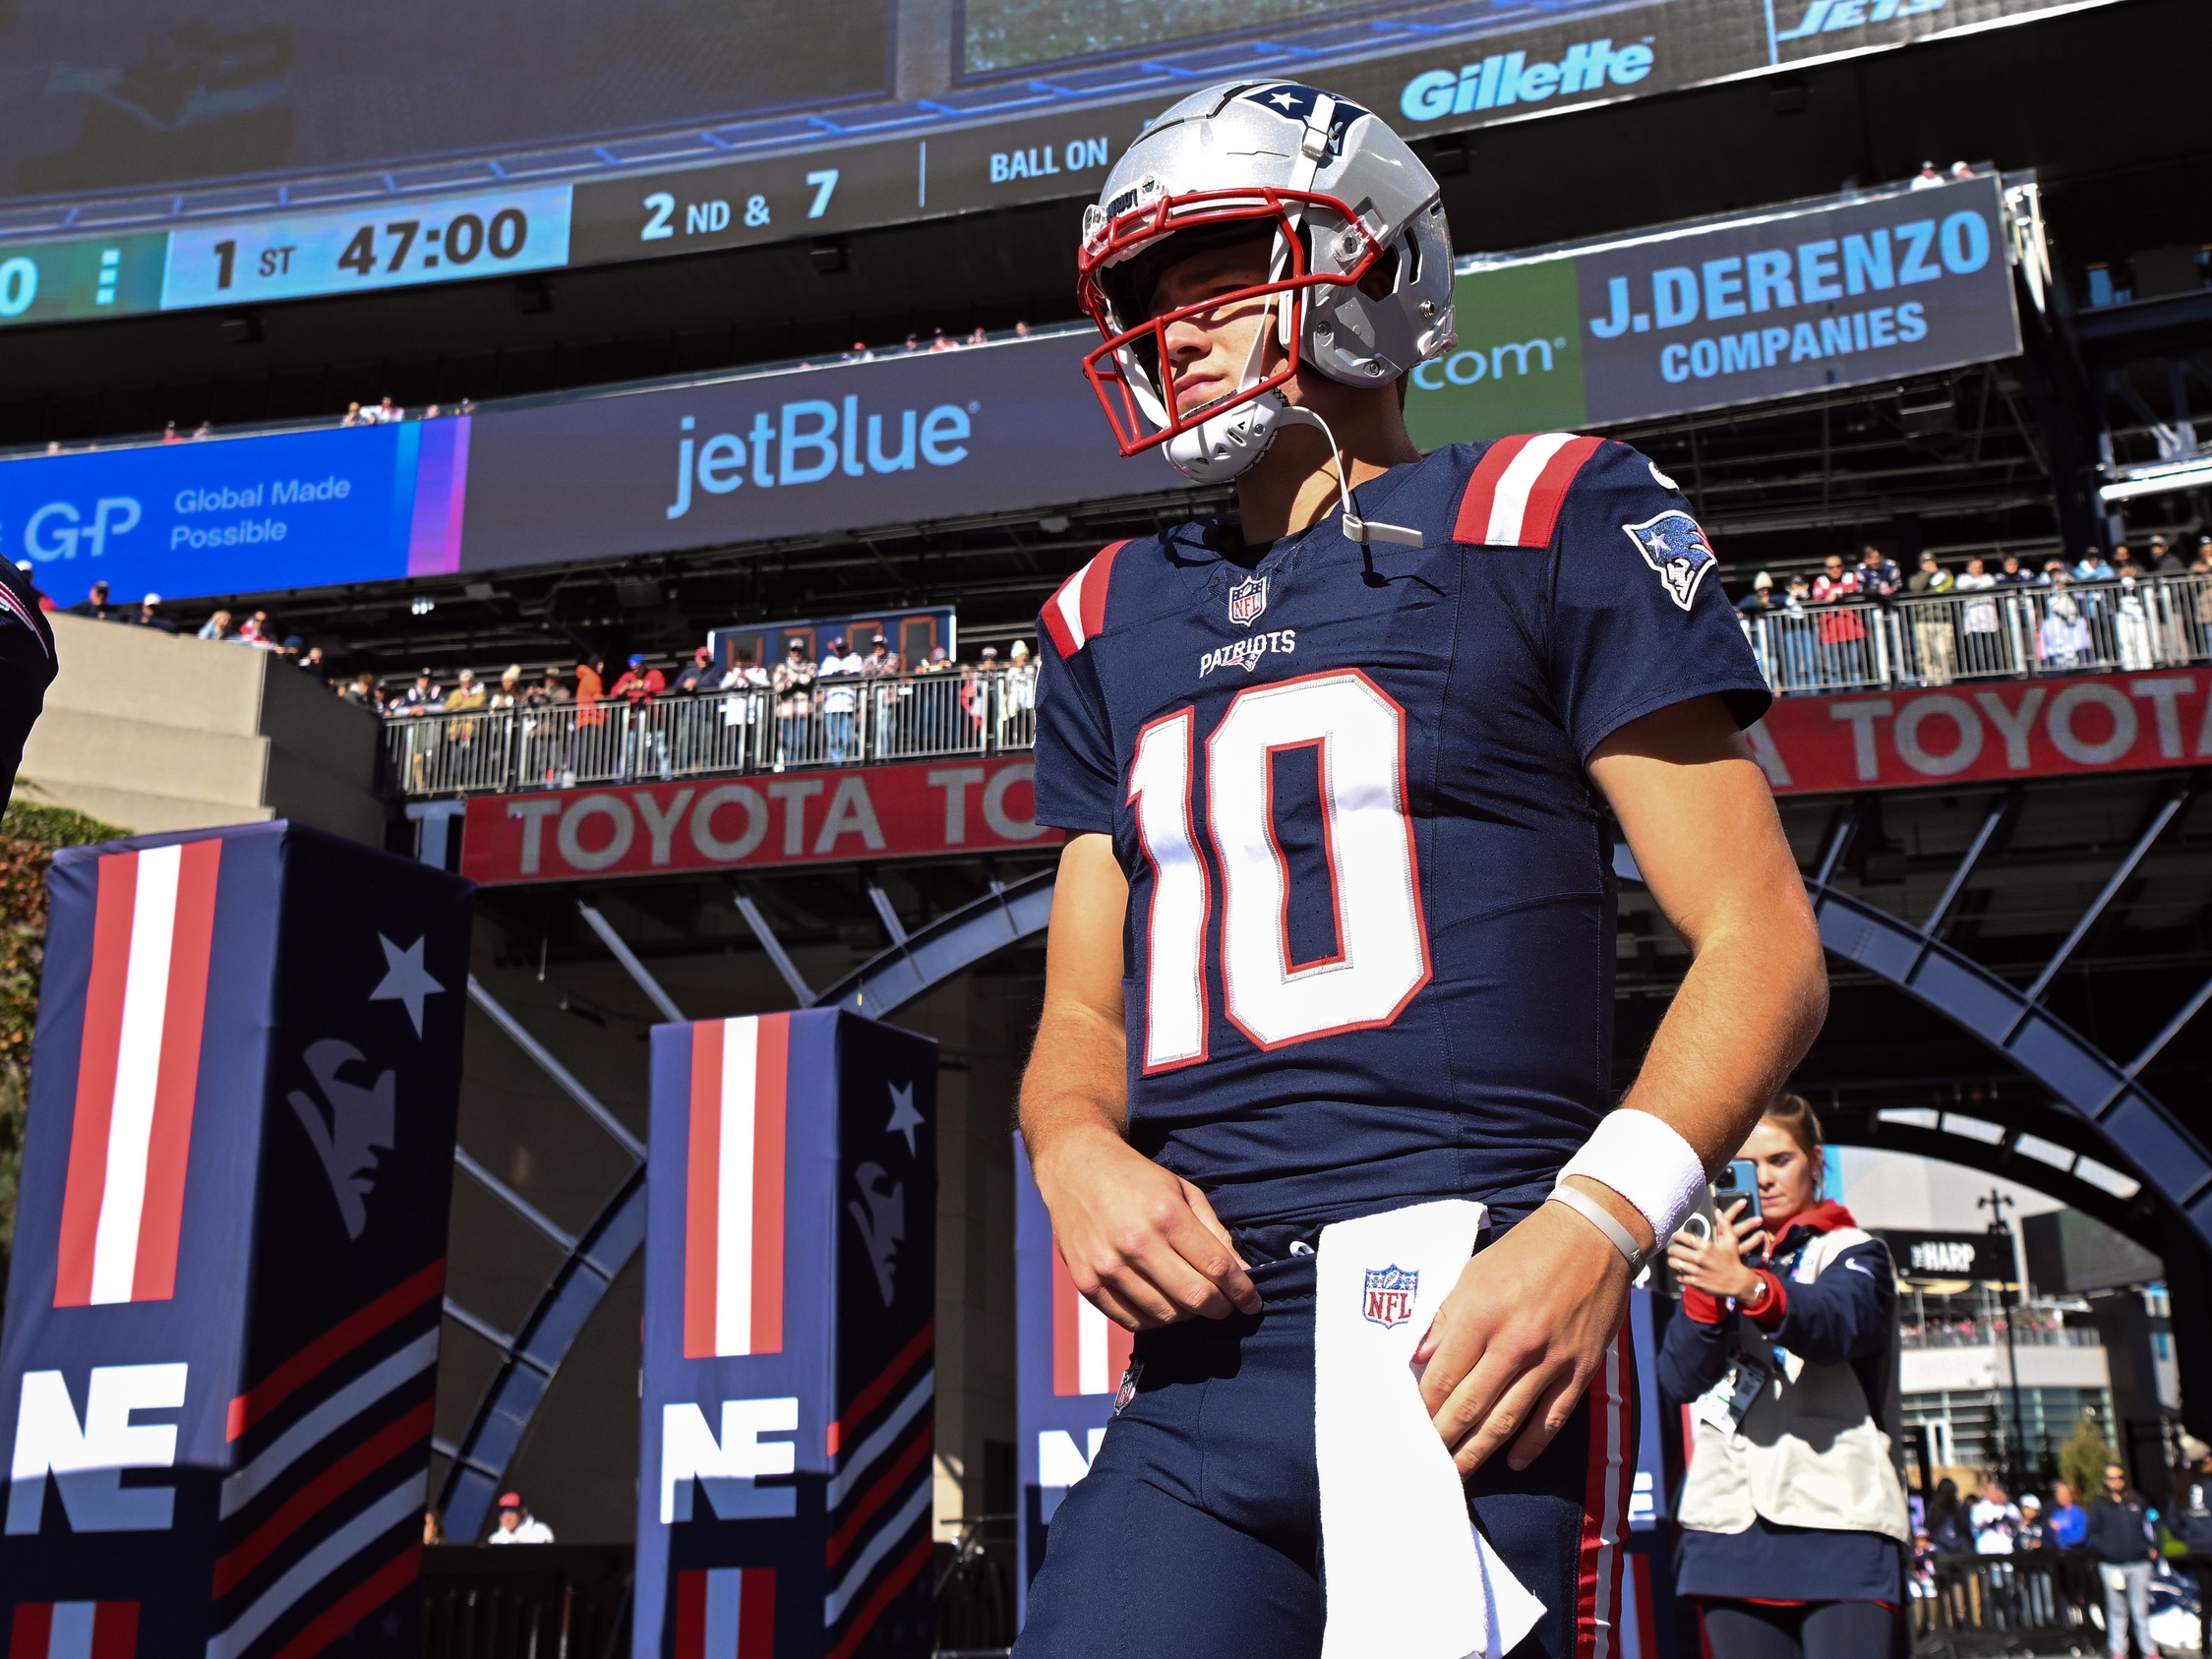
I think their system works as long as the player produces at the top % of players in that position. I look at it like this: WR #A is the top of the market and he plays at the top of the position, then the ROI is a wash. He's the #1 guy and has the #1 production, so everything is fine. If they pay a guy 75% of the market and he produces in the top 95%, then that player has a very high value. If a player is paid 50% of the market but only produces 60% of the market production, that player still has better value than say the #2 WR who performs at 80% of the market but is paid at 99% of market for the position. Follow? I feel they don't want to be paying 90-100% of the market when they are almost assured that player will underperform the contract, whereas the guy paid at 50% of the market has a very good chance of being on the right side of production. All this is skewed by Brady's performance, because he was able to raise guys up and get them to a higher % of ROI.
I think that's true to a certain extent, and I get what you're saying and think it's a valid point. At the same time, what's also interesting is that I also can't recall over the last two decades them having a player who was even either in the top 6 or 8 (outside of Moss & Welker) in terms of overall production, touchdowns, etc., even despite the lower salary, albeit I can't remember what Moss' salary was after he was acquired, nor do I remember off the top of my head if they bumped his salary. Aside from that, in the post-Edelman era, Meyers and Bourne are the only players I can recall recently who even approached 800+ yards (Bourne had 800 in 2021, Meyers had 866, and 804 in 2022), which obviously makes your point in terms of what they were being paid.
Looking back after doing some digging, here's where their top receivers have fallen in terms of receiving yards as it relates to the rest of the league's top 25 in a given season:
2000
Terry Glenn 963yds, 6 TDs (20th)
Troy Brown 944yds, 4 TDs (21st)
2001
Troy Brown 1199yds, 5 TDs (10th)
2002
None
2003
None
2004
None
2005
(NFL's stat tool had an issue with this season ...)
2006
None
2007
Randy Moss 1493yds, 23 TDs (2nd)
Wes Welker 1175yds, 8 TDs (11th)
2008
Wes Welker 1165yds, 3 TDs (9th)
Randy Moss 1008yds, 11 TDs (21st)
2009
Wes Welker 1348yds, 4 TDs (2nd)
Randy Moss 1264yds, 13 TDs (5th)
2010
None
2011
Wes Welker 1569yds, 9 TDs (2nd)
Rob Gronkowski 1327yds, 17 (6th)
2012
Wes Welker 1354yds, 6 TDs (8th)
2013
Julian Edelman 1056yds, 6 TDs (21st)
2014
Rob Gronkowski 1124yds, 12 TDs (15th)
Julian Edelman 972yds, 4 TDs (25th)
2015
Rob Gronkowksi 1176yds, 11 TDs (12th)
2016
Julian Edelman 1106, 3 TDs (13th)
2017
Rob Gronkowski 1084yds, 8 TDs (10th)
Brandin Cooks 1082, 7 TDs (11th)
2018
None
2019
Julian Edelman 1117yds, 6 TDs (18th)
2020
None
2021
None
2022
None
2023 (Through Week 17)
None
So that hopefully provides some context in terms of where New England's "top guy" fell as it relates to the rest of the league.
Now, the other part of this argument is going to be where New England's offense fell overall, since through most of the Brady era, it was a collective effort.
Here's how that breaks down:
2000 - 22nd
2001 - 19th
2002 - 21st
2003 - 17th
2004 - 7th
2005 - 7th
2006 - 11th
2007 - 1st
2008 - 5th
2009 - 3rd
2010 - 8th
2011 - 2nd
2012 - 1st
2013 - 7th
2014 - 11th
2015 - 6th
2016 - 4th
2017 - 1st
2018 - 5th
2019 - 15th
2020 - 27th
2021 - 15th
2022 - 26th
2023 (Through Week 17) - 28th
I don't think they look at stats, per se. I think they look at the whole picture, real money ball analysis type stuff, not just fantasy football numbers. I think they analyze everything.
And I think, to your point, if you look at the above, the "big picture" comes into play because they collectively had groups that were competitive, to the point they were still top 10/11 despite not really always having a top 10 guy, albeit Brady made that go. The issue right now is, until they find someone that can execute remotely close to his level, it's going to be challenging to put a group together that's competitive enough to give that guy a chance.