PatsFans.com Menu
PatsFans.com - The Hub For New England Patriots Fans

Suggs acuses Goodell of Superbowl Blackout.


Which has already been explained. You're noting the difference in win probabilities by seed between pre-salary cap era teams and salary cap era teams. [/B]If your conclusion is anything other than "the salary cap increased parity among playoff teams", then you would be failed out of a 101-level statistical modeling course for reaching that conclusion.


So based on an extraordinarily small sample size, while failing to account for obvious outside factors that would create the change that you're observing, you're ready to call shenanigans? Again, I don't want to be a **** here, but you're little plowing through just about every fallacy in the Statistics 101 textbook. You're genuinely clueless as to the subject matter that you're dealing with.


There's nothing to disprove. The facts are the facts. Small sample size aside, the data suggests that the league has achieved parity in recent years, as compared to past years. Nobody has denied this at any point in this thread. Where you seem to think that this proves your case, you're simply wrong, because it's easily explainable without resorting to all of the insane bull**** that you're espousing. It's just the salary cap having its intended effect. Nothing more and nothing less.


For the 4th time in this thread: NO I AM NOT!

I have looked at it prior to the salary cap era. Prior to the 5th seed. Prior to the 6th seed. Including the 6th seed. After the divisional reshuffle. And yes also as a whole. And that is not simply what's being compared. So please stop repeating this nonsense, cause it's just not true.


In addition, you are insanely dense if you do not understand that playoff format probabilities and salary cap do not have the impact you believe it to have. If anything, in this day and age, they should adhere even closer to the expected probabilities of each seed due to the current tournament structure. Not deviate more, but adhere even CLOSER! The salary cap argument works in favor of my point, not yours! I don't think you have grasped this yet.

Even IF you were to assume the seeds were 100% of equal strength due to the salary cap era(which is nonsense in the first place) you should STILL expect to get results that are similar to this:


SB appearance probabilities:

Seed 1: 36.00%
Seed 2: 29.00%
Seed 3: 11.00%
Seed 4: 10.00%
Seed 5: 7.00%
Seed 6: 6.00%

Do you understand this?
 
All I can tell you is THIS is the actual probability of appearing in a Superbowl, based on the current playoff format and league-wide homefield advantage percentages of appearing in a Superbowl.

SB appearance probabilities:

Seed 1: 36.00%
Seed 2: 29.00%
Seed 3: 11.00%
Seed 4: 10.00%
Seed 5: 7.00%
Seed 6: 6.00%

You've asserted those numbers over and over again. With no evidence for them other than your say-so. Let's see the source of the numbers, or if you've calculated them, the input data and the formulae you used.
 
It's one thing when crazy paranoid fans(like me) says things about it -like the fact all 6 seeds won a superbowl in a 6 year span up to 2012 among other statistics improbabilities(impossibilities?) that have taken place more and more recently, but it's another when players start showing concern. And this time it's from the Superbowl winners, not losers.


So should we start emaling Goodell and ask for permission if we can win one this year or does he have the Donkeys locked in?


HAHA! You still bitter with spygate huh brother? Want to see him gone?

I dont see too badd with him! It looks to me like he doing good job. It must get old with all the over paid divas.
 
You've asserted those numbers over and over again. With no evidence for them other than your say-so. Let's see the source of the numbers, or if you've calculated them, the input data and the formulae you used.

LOL. It's not my "say-so". It's basic math.

But here, I actually happened to get them from Brian Burke of advancednflstats.com

Advanced NFL Stats: The Importance of Playoff Seeding

You don't actually need Brian to do this for you. Basic math is all the proof in the world you need to calculate probabilities for a single elimination tournament, with 4 seeds getting a bye week and home field playoff advantage. The NFL home team typically enjoys a 57% homefield advantage. That is the only number you need, and that one you can get from the NFL. His numbers are rounded to 60%.

He has a good argument that I particularly agree with for 60%, but if you prefer to stick with the basic NFL homefield advantage, then for example the probability of the #1 seed of reaching the superbowl would be 0.57 * 0.57 = 32.45%. It has to win 2 games to get there. And a 16.2% chance of winning the Superbowl. That's for any 1 seed. Since there are two #1 seeds, then the probability that a #1 seed would win the Superbowl in any particular year is right back to 32.45%. In other words, about once every 3 years.
 
You've asserted those numbers over and over again. With no evidence for them other than your say-so. Let's see the source of the numbers, or if you've calculated them, the input data and the formulae you used.

I think it's probably time to stop debating this thing on the merits. I mean, what difference does it make what the answer to your question is? At the end of the day, it turns into an argument that Roger Goodell is performing the most insane and unnecessary felonious activities in the history of sports.

The notion that he's on the phone with refs telling them to call the game to make a five seed win is so silly that it doesn't deserve the seriousness that talking about stats implies.
 
There was some random Dallas Banker who wrote an entire book based on just articles he gathered around the internet, but he also did some independent statistical research and declared it was statistically impossible for the Pats to be as successful at home as they have been.

Thoughts, PatriotSeven?
 
HAHA! You still bitter with spygate huh brother? Want to see him gone?

I dont see too badd with him! It looks to me like he doing good job. It must get old with all the over paid divas.

Eh, Suggs couldn't even get a job sweeping up the grounds at the Cannstatter Volksfest.
 
SB appearance probabilities:

Seed 1: 36.00%
Seed 2: 29.00%
Seed 3: 11.00%
Seed 4: 10.00%
Seed 5: 7.00%
Seed 6: 6.00%

Do you understand this?
This is just something made up out of thin air. The difference in talent from the #1 seed to the #6 is so small these days, that there is no way whatsoever the chances of the #1 seed should go 6 times more often, despite them having HFA and 1 fewer game.
 
Re: Re: Suggs acuses Goodell of Superbowl Blackout.

There was some random Dallas Banker who wrote an entire book based on just articles he gathered around the internet, but he also did some independent statistical research and declared it was statistically impossible for the Pats to be as successful at home as they have been.

Thoughts, PatriotSeven?

Lol. I heard that too.
 
This is just something you're making up out of thin air. The difference in talent from the #1 seed to the #6 is so small these days, that there is no way whatsoever the chances of the #1 seed should go 6 times more often, despite them having HFA and 1 fewer game.

Ok so you clearly don't understand or believe in probabilities and think it's voodoo magic. I would also assume you believe 2+2= 4 is something I made up out of thin air? It sounds equally as stupid as your statement.

And I didn't make them up. You can also do them yourself, or follow the link and read them from a third party source, like Brian Burke of advancednflstats.com. Let me post it again since you missed it:

http://www.advancednflstats.com/2011/12/importance-of-playoff-seeding.html

Bottom of the article. Chart. Read the explanation.

Let me repeat it to you, since when I wrote it in bold you didn't seem to grasp it: those numbers are based on absolute parity! Those numbers ARE based on the fact that all teams are basically of equal strength.

It has nothing to do with talent level. Nothing. That advantage doesn't come from team strength. It comes simply from the fact there is a BYE WEEK, and home field advantage. Top seeds play 1 less game and play all their games at home.

And yes, that is exactly what they are. It's basic math. Vegas and casinos as well as any other domain in the world, from the stock market, to outer space, to quantum mechanics, exists because probabilities are what they are over a long enough sample.

You can believe 3/4 is 75%, or you are free to choose to believe it's entirely something else and math isn't real. Doesn't really make a difference to me. But if you think it means some random number, and that the result of that division isn't in fact 75%, then we don't really have much to discuss.
 
What I'd like to know is why Suggs hasn't been hit with a big fine yet.

Coaches and players can't criticize the refs but this guy can say the commish deliberately tried to impact the Super Bowl game and he doesn't get at least a huge fine for that?
 
Some of what I'm reading in this thread reminds me of those dopey Pats haters who are convinced the Pats were handed the Super Bowl in 2001 because it was a "Patriotic" year and the league wanted a team named the Patriots to win the Super Bowl....
 
The funny thing about this is that I don't believe Goodell had anything to do with the blackout but I don't believe it couldn't have been intentional either on somebody's part. Watching the game before the blackout, I commented how it was going really fast in terms of time compared to previous years. Why does this matter?. A slower pace and longer game is important when you have sponsors paying millions of dollars for 30 and 60 second ads...Then there's a half hour blackout and the game still ended in the same amount of time as a "usual" Super Bowl. I'm sure it was just dumb luck.............
 
What I'd like to know is why Suggs hasn't been hit with a big fine yet.

Coaches and players can't criticize the refs but this guy can say the commish deliberately tried to impact the Super Bowl game and he doesn't get at least a huge fine for that?
I'm no fan of Goodell's, but I'll say this: if I were Goodell I'd have this guy's ass on the carpet in front of me demanding an explanation, and my first question would be, "where's your proof and/or evidence. As my old man used to say of me, "more nerve than brains."
 
Even IF you were to assume the seeds were 100% of equal strength due to the salary cap era(which is nonsense in the first place) you should STILL expect to get results that are similar to this:


SB appearance probabilities:

Seed 1: 36.00%
Seed 2: 29.00%
Seed 3: 11.00%
Seed 4: 10.00%
Seed 5: 7.00%
Seed 6: 6.00%

Do you understand this?

But according to advancednflstats.com the results are similar to the probabilities. The chart is right there in the link you posted.
 
LOL. It's not my "say-so". It's basic math.

But here, I actually happened to get them from Brian Burke of advancednflstats.com

Advanced NFL Stats: The Importance of Playoff Seeding

You don't actually need Brian to do this for you. Basic math is all the proof in the world you need to calculate probabilities for a single elimination tournament, with 4 seeds getting a bye week and home field playoff advantage. The NFL home team typically enjoys a 57% homefield advantage. That is the only number you need, and that one you can get from the NFL. His numbers are rounded to 60%.

He has a good argument that I particularly agree with for 60%, but if you prefer to stick with the basic NFL homefield advantage, then for example the probability of the #1 seed of reaching the superbowl would be 0.57 * 0.57 = 32.45%. It has to win 2 games to get there. And a 16.2% chance of winning the Superbowl. That's for any 1 seed. Since there are two #1 seeds, then the probability that a #1 seed would win the Superbowl in any particular year is right back to 32.45%. In other words, about once every 3 years.

First of all, I'm going to borrow from the source that you so graciously linked:

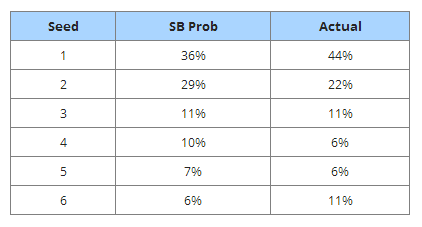
Here is how the probabilities work out for each seed. Also listed are the actual proportions of Super Bowl appearances since 2002 when the current format began. Keep in mind that the 'actual' numbers reflect the effect of both seeding and team strength, and that there are only 18 observations since '02, so they will be statistically noisy. Also note that the chances will not sum to 100% due to rounding. (Thanks go to my research intern for compiling the actual numbers.)

t5qbNkx.png

1. So basically, you're up in arms because the probability that you expect based on that formula doesn't match up with the numbers from an era when they weren't even using that playoff format (see: the text that I bolded for it, since you must have missed it the first time around).

2. As the writeup that I quoted mentioned--and as I've been telling you this entire time--the sample size is so small that you wouldn't even reasonably expect the results to match up to the probabilities. The sample size is way too small. I can't repeat this enough times, because in reality the argument begins and ends here. The fact that it does actually match up so closely--despite your claims that it doesn't--is actually pretty unlikely. Every single numbers-based argument that you've brought to the table can be explained by the sample size, but even then it isn't necessary.

You're moving the goalposts yet again, but you're still wrong, because now you're claiming that deviation from an expected value within a minuscule sample size is evidence that the league is fixed. And you're claiming that despite the fact that the numbers actually match up very closely.

It's pretty clear that you're not nearly as informed on this subject matter as you seem to think you are.

Just to reiterate, at the start you were claiming that proof of game-fixing is in that lower-seed teams make the Super Bowl more often than they used to (1975-2005 being the old dataset, IIRC).

In response, I pointed out that this is because the salary cap era has led to increased parity between teams.

You responded by claiming that this isn't the case, because #1 and #2 seed should make the Super Bowl far more often simply by virtue of having home field advantage and a bye week. To support this argument, you provided a table showing how frequently each seed would be expected to make the Super Bowl.

You were committing a pretty egregious error by comparing results from 1975-2001 to an expected value that's based on a playoff model that was introduced in 2002.

As it turns out, the actual results, starting when the playoff format that led to those numbers was introduced, are extremely close to the expected values. Which, if anything, makes this evidence *against* the point that you're trying to make.

Does that sound about right?
 
Someone needs to understand the concept of "small sample size".

I just wrote a program that takes the probabilities and picks a seed as appearing in the superbowl using those probabilities. I had the program run the selection ten times (i.e. for ten seasons) and display the percentage of the time that each seed appeared in the SB in those ten seasons. Here's one run:

Code:
Seed		Theor		Actual
1		36		10.00
2		29		20.00
3		11		20.00
4		10		20.00
5		7		10.00
6		6		20.00

Oh noes! Goodhell hacked my program!

Or a different run. Guess he hacked it again!
Code:
Seed		Theor		Actual
1		36		20.00
2		29		20.00
3		11		20.00
4		10		20.00
5		7		10.00
6		6		10.00

Then there's these runs. I guess Goodell left my program alone for a change:
Code:
Seed		Theor		Actual
1		36		50.00
2		29		30.00
3		11		 0.00
4		10		10.00
5		7		 0.00
6		6		10.00

Seed		Theor		Actual
1		36		40.00
2		29		30.00
3		11		10.00
4		10		10.00
5		7		10.00
6		6		 0.00

And here's what happens when I run my program for a million seasons. As you can see, it's a fair simulation. (The actuals are 1/99th "too high" because the numbers in PatriotSeven's chart only add to 99%, not 100%. If I change, say, the 6% to 7% so that the theoreticals add to 100%, then the actuals end up almost exactly matching all the theoreticals over a million trials.)

Code:
Seed		Theor		Actual
1		36		36.36
2		29		29.29
3		11		11.06
4		10		10.14
5		7		 7.06
6		6		 6.08

It's almost like the Law of large numbers is a real thing, and anyone who attempts to call shenanigans based on a sample size of 10 has no idea what they're talking about.
 
Against better judgement, a couple more thoughts.


1.) Advanced NFL Stats assigns a weighted factor of 60% to the home team with sketchy statistical evidence to back that up, mostly an anecdotal reference. He claims that since playoff "teams are close in ability, home field becomes more decisive". Yet when you click on the link where he came to that conclusion (based on only a five year sample of games), the author openly writes that "admittedly, the effect is not consistently smooth, which suggests there is a good deal of randomness involved".

That sure sounds to me that the numbers are anything but ironclad absolutes. he started out with 57% based on Vegas giving home teams a 3-point advantage and upped it to 60% ... yet later states that his statistics show that home field advantage is "extremely linear at about 2.5-3.0 points regardless of the match-up type".

Sounds like he's contradicting himself, and his analysis should if anything go down from the 57% starting point rather than up.

2.) All that aside, let's say that the numbers are right. Now for an exercise I am going to roll two dice and see what they total. Once I have done that I discard those dice, get some new dice and repeat ... about 50 times.

Now I realize the percentages aren't exactly the same, but bear with me consider these total on the die to correspond to a seed winning the Super Bowl

2 = AFC 6th seed ... 12 = NFC 6th seed
3 = AFC 5th seed ... 11 = NFC 5th seed
4 = AFC 4th seed ... 10 = NFC 4th seed
5 = AFC 3rd seed .... 9 = NFC 3rd seed
6 = AFC 2nd seed .... 8 = NFC 2nd seed
7 = AFC or NFC 1st seed

For the exercise I roll the dice 80+ times (representing all the Super Bowls played), and the results are pretty much as expected. I am going to use both the winner and loser of the Super Bowl since it was suggested a few pages back that I needed to look at both.

Then over the last 14 rolls I have come up with the following:
2 (AFC, 2006)
7 (NFC, 2006)
5 (AFC, 2007)
7 (NFC, 2007)
11 (NFC, 2008)
7 (AFC, 2008)
6 (AFC, 2009)
10 (NFC, 2009)
7 (NFC, 2010)
7 (AFC, 2010)
12 (NFC, 2011)
6 (AFC, 2011)
10 (NFC, 2012)
7 (AFC, 2012)

I'm not going to run a regression analysis, but I don't see anything terribly odd with those numbers. It's not something that would have me believed that I have been slipped loaded dice, thus altering the results.


At most the only thing that has been proven is a slight statistical anomaly. There is absolutely no evidence to support a cause for this. The statistics do not prove the conspiracy theory, you need something far more concrete than that. The most likely cause is small sample size, but there are many other possible reasons as well.

- Flat salary cap has resulted in the delta in talent between one team and the next to become smaller; this has led to less HFA in playoffs.

- Players becoming bigger, stronger and faster have led to more injuries. This, along with more awareness of concussions have led to more teams using backup players as the season goes on - including the playoffs. Backups having a larger impact on the outcome results in previous records (and seeding) becoming less relevant to the outcome.

- The more games that are played, the more that teams have become adept at scouting opponents and coming up with game plans to defeat them. Clubs that had an advantage early in the season have less of an advantage later on. This means teams that ran up a big winning record early in the year should not be as heavily favored to win later.

I'm not saying that any of these are the actual reasons; I'm just pointing out that one can come up with a virtually unlimited number of reason for those stats (lower seed teams winning) over a five year span.

Another thing to consider: if owners wanted to profit from the fixing of games (i.e., have the underdog win), wouldn't they have been doing it years ago when they were making far less money from television? And wouldn't they accept money from the networks to insure that big market teams (that represent more viewers) always went deep into the playoffs?


One last thing: it has been mentioned about the Steeler fan/Texas investments broker (who was guilty of fraud) attempted to use statistical analysis to prove that it was impossible for the Patriots to be as successful as they were; the author of Advanced NFL Stats attempted to do the same thing back in 2007.

I guess that all improbable feats must have been rigged, from UCLA's basketball team winning 88 consecutive games to Joe DiMaggio's 56-game hitting streak to Jerry Rice's 274 consecutive games with a catch to Johnny Vander Meer pitching two consecutive no-hitters.
 
Last edited:


Patriots Kraft ‘Involved’ In Decision Making?  Zolak Says That’s Not the Case
MORSE: Final First Round Patriots Mock Draft
Slow Starts: Stark Contrast as Patriots Ponder Which Top QB To Draft
Wednesday Patriots Notebook 4/24: News and Notes
Tuesday Patriots Notebook 4/23: News and Notes
MORSE: Final 7 Round Patriots Mock Draft, Matthew Slater News
Bruschi’s Proudest Moment: Former LB Speaks to MusketFire’s Marshall in Recent Interview
Monday Patriots Notebook 4/22: News and Notes
Patriots News 4-21, Kraft-Belichick, A.J. Brown Trade?
MORSE: Patriots Draft Needs and Draft Related Info
Back
Top