I hate threads like this because they really don't offer any context. If I told you that this guy failed 7 out of 10 times to complete his goal, you'd think he's a failure. If I told you he was a baseball player with a .300 average, suddenly he's pretty good at what he does. What's the difference? A little thing called perspective.
You can't judge the draft record without first understanding what is "normal" or "average." For all you know, BB might be ahead of the curve. Or maybe way behind. But without looking at the bigger picture, you can't really conclude anything, just point out the obvious.
So let's actually do some work rather than talk out of our asses.
First, we need to figure out what constitutes a "successful" drafted WR. What is the criteria? We could go by Pro Bowls, or 1,000-yard seasons, or starts, or catches. If you ask 20 people, you'll get 20 different answers. So instead, let's use
Career AV. It's an imperfect number, but so is every stat in football. I put more weight into it than the way most people reach their "conclusions."
Career AV is an interesting number to use because it gives a single number to a player's value. It doesn't mean a guy who is a 14 is worse than a guy who is a 16, but it looks at their production. However, it also rewards better players with a higher number. So a Calvin Johnson gets a significantly higher number than 3 JAGs combined who had decent careers. This way we can somewhat evaluate the impact of those picks. In other words, it isn't about the % of picks who "make it" based on whatever criteria we decide, but rather their overall impact.
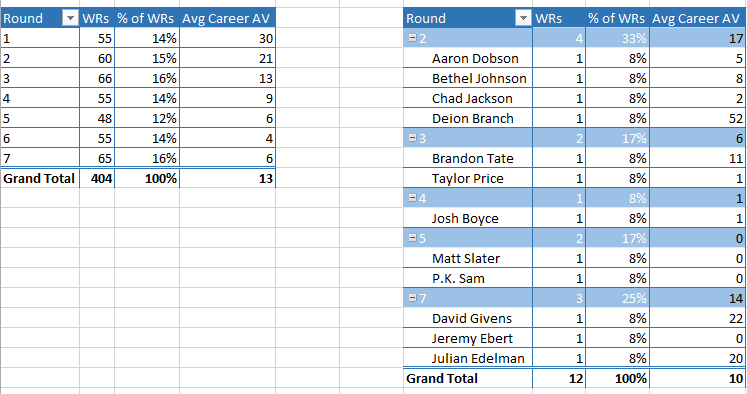
By looking at every drafted WR since BB took over the Patriots (2000 to 2014), we can calculate an average Career AV mark per round for receivers. We can also see where most receivers are drafted. We can also compare these figures against the Patriots draft picks in this period to see how they compare.
Out of 404 WRs, you can see roughly the same number of prospects are drafted in each round. The Career AV average for WRs is 13 overall. As expected, the higher up they are, the better they tend to be with the exception being with 7th rounders having slightly higher AV rankings. Part of this may be that more receivers were drafted here.
You also notice the Patriots are right around the mark more or less for the 2nd round. The big misses have been in rounds 3-5, but bear in mind that these are small sample sizes, and one decent player out of those 5 picks would change the equations. It's somewhat balanced by our luck in the 7th. The noticeable exception is the lack of a 1st round WR.
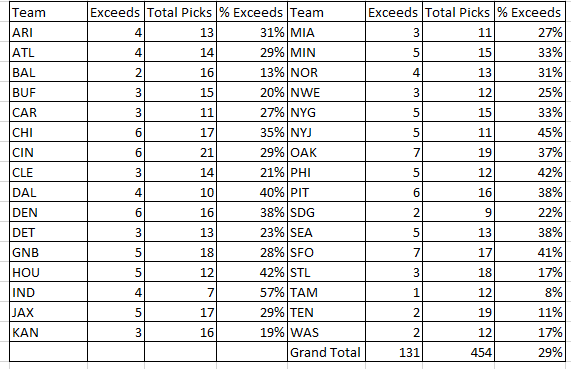
In the next chart, we can look at all teams, how many picks they're spending on the position, and their average Career AVs. This should tell us if we're the worst team ever at drafting WRs.
Top 5s are highlighted in green, while bottom 5s are in red. Despite the Pats not spending a 1st round pick on a WR, we are not at the top or bottom of the pile. Indy and New Orleans have done a great job with those WR picks, being at the bottom 5 in total picks, but in the top 5 for output. Some terrible teams haven't gotten much bang for their buck such as Oakland and Tennessee, but interestingly enough, San Fran and Baltimore haven't done any better despite spending more picks than the Patriots.
I might go into these numbers a bit more but I'm tired. The point is simply that BB could possibly spend a 1st rounder or more picks on WRs, and maybe we need to do better in the middle rounds, but overall, we're getting decent value for our WR draft picks. We're certainly nowhere near the worst the way many posters in this thread are acting.