Wondering how the top-5 scoring defenses are doing on average I collected all data grouped into halves and then normalized them by cutting off the two halves that exceeded one standard deviation of the average points allowed in both directions. So for example, for the Patriots the first halves of the Texans and first Bills game was removed (best and worst defensive first half) and for the second halves again the Texans and the second half of the week 2 matchup against Miami was removed.
The result was this:
A couple of observations:
The result was this:
A couple of observations:
- The Patriots pass defense is significantly better in the second half. In terms of yards per attempt only the Eagles defense performs better in the second half. Part of it is surely the fact that the Patriots have entered the second half leading in all but one game so they are trading the rush defense for better pass coverage.
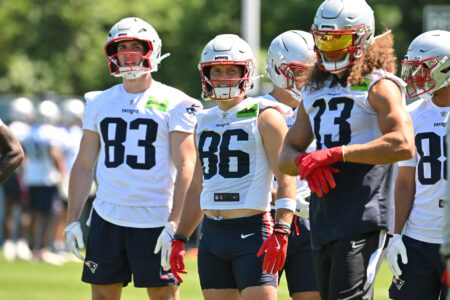
- The run defense of the Patriots is pretty good. Non-QBs have only had five runs of 15+ yards for 120 yards total (three to Gillislee alone) with one of those runs coming late in the fourth quarter by Lamar Miller with the score at 27-0. Last season the defense allowed 17 such runs for 381 yards.
- Pass rush and sack numbers are the defense's biggest problem, which is why the Patriots rank last in net yards per attempt. The Patriots coverage, despite the insecurity at the CB2 position, is good, in pure yards per attempt they are in the same region as Seattle and better than the Eagles. The lack of a quick pass rush makes them vulnerable to a dink-and-dunk style, but downfield coverage is very good. The Patriots have allowed seven pass playes of 30+ yards, the same number as Denver and fewer than Seattle (eight) and Philly (nine). Only the Vikings have allowed fewer with five. All three NFC teams though have already had their bye and thus one game less.
- With the improvement the last few weeks the normalized Patriots' 3rd down defense is actually quite respectable at 36.7%, right in the range of the other top defenses.
- Denver's defense is pretty insane against the pass. No other team has that combination of shutdown corners and a great pass rush. But unlike last year they are vulnerable to the run. Denver's allowed nine runs of 15+ yards to non-QBs for a total of 228 yards. That's already more than last year when they had eight such runs for 190 yards.
- The Eagles defense and their league leading DVOA is quite inconsistent. Of that bunch they have by far the worst first half defense while their second half defense is absolutely stifling. That inconsistency is especially present in the first half with the standard deviation of the points allowed being 7.72. The Eagles have given up 21 first half points to both the Redskins and Lions.
- The Seahawks probably have the best-balanced defense. While their pass defense isn't as overwhelming as it used to be they have a good pass rush and are a very good run D (only three 15+ yard runs allowed). Teams have a hard time moving the ball against them and when they make it into the red zone it gets even harder for them to pick up TDs.
- The Seahawks and Patriots are both at the top of first half points per drive while being on the bottom for second half points per drive. Probably has something to do with them being frontrunners. The Patriots are outscoring their opponents 74-17 in the first quarter and the Seahawks 31-6 (the halftime score is 115-57 for the Patriots and 78-41 for the Seahawks). The only quarter the Patriots lose on aggregate is the fourth with a 36-41 scoreline (the Seahawks lose both quarters in the second half, 12-24 and 38-41).
- As good as the Patriots (and Seahawks) are in the first half, the same counts for the Broncos and Eagles in the second. Denver is 91-24 in the fourth quarter (they are 16-54 in the first). The Eagles meanwhile are 67-9 in the third.