Registered Members experience this forum ad and noise-free.
CLICK HERE to Register for a free account and login for a smoother ad-free experience. It's easy, and only takes a few moments.MassLive | Posted: 06/10 👁: 20 |
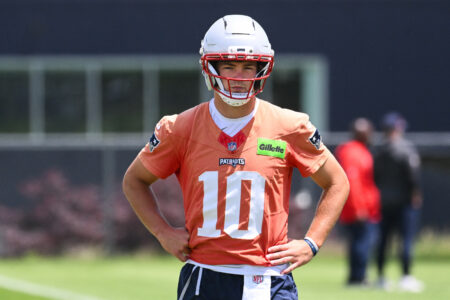
| All-Pro safety: ‘Nightmare for defenses’ A.J. Brown already developing chemistry with Drake Maye |
MassLive | Posted: 06/10 New! |
| How a seven-time NFL captain is earning the respect of his new Patriots teammates |
MassLive | Posted: 06/10 New! |
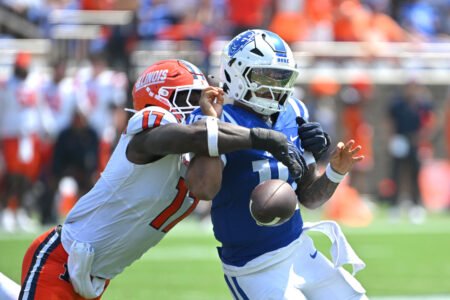
| Karen Guregian: The case for keeping Kayshon Boutte with the Patriots |
Boston.com | Posted: 06/10 New! |
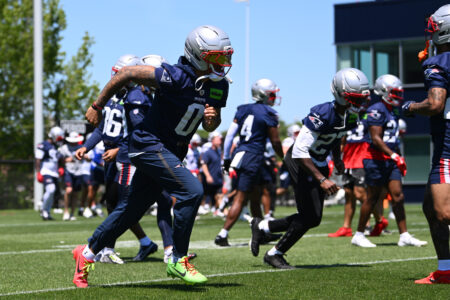
| 5 takeaways from Day 1 of Patriots minicamp |
Boston.com | Posted: 06/10 New! |
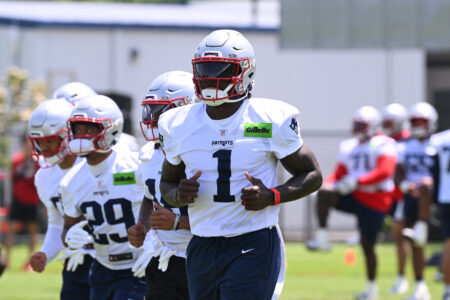
| Christian Gonzalez on ongoing contract stalemate: ‘I want to be rewarded as a Patriot’ |
| Mandatory Minicamp 6/9-11 3 Reactions | 06/09 at 4:06 pm |
| 2027 Watch List 3 Reactions | 06/10 at 3:54 am |
| TODAY'S TOP POSTERS: | # | |
| PatsFan2 | 8 posts | |
| mayoclinic | 7 posts | |
| Wozzy | 6 posts | |
| PatsFanInVa | 4 posts | |
| mike_usagisan | 4 posts |
From our archive - this week all-time:
May 26 - June 10 (Through 26yrs)