Registered Members experience this forum ad and noise-free.
CLICK HERE to Register for a free account and login for a smoother ad-free experience. It's easy, and only takes a few moments.MassLive | Posted: 06/09 👁: 22 |
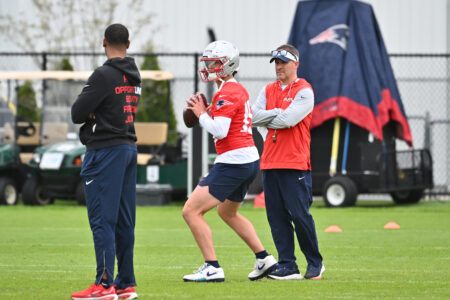
| 5 things to watch at Patriots minicamp |
MassLive | Posted: 06/09 New! |
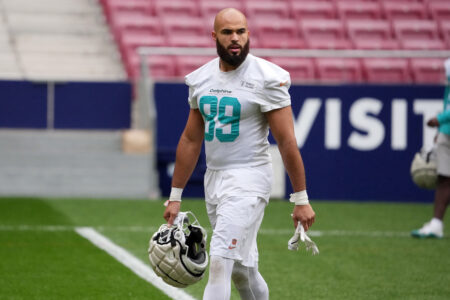
| Rob Gronkowski chimes in on A.J. Brown, and what his arrival means for the Patriots |
Boston.com | Posted: 06/09 👁: 20 |
| A 2025 NFL re-draft has Patriots choosing another offensive lineman with 4th overall pick |
The Athletic | Posted: 06/09 New! |
| What's it like to be a Cowboys fan? Plus: Why Russell Wilson is not a Hall of Fame quarterback |
MassLive | Posted: 06/08 New! |
| Patriots sign first-round pick Caleb Lomu to rookie contract |
| 2026 General NFL News/Discussion/Non-Patriots free agents 4 Reactions | 06/08 at 6:52 pm |
| 2026 General NFL News/Discussion/Non-Patriots free agents 3 Reactions | 06/09 at 1:13 am |
| TODAY'S TOP POSTERS: | # | |
| PatsFan2 | 10 posts | |
| Wozzy | 8 posts | |
| Real fan 02 | 6 posts | |
| mayoclinic | 6 posts | |
| captain stone | 4 posts |
From our archive - this week all-time:
May 25 - June 9 (Through 26yrs)